
Recently I had an article published in Pimlico Journal covering the changing ethnic makeup of schools in England (2003 to 2026), Wales (2004 to 2025), Scotland (2003 to 2025), Northern Ireland (2006 to 2026), as well as independent (private) schools (2009 to 2026). You can read the article here.
This page will also contain other years (some older and some newer) for years not covered in this article.
Schools in England
This section contains an overview of all the sources used to compile the ethnic makeup of state-funded primary and state-funded secondary schools in England from 2003 to 2026, though releases for 1996 to 2002 are linked if you are interested.
As the school census takes place in January, the releases used to be labelled January followed by the year (e.g. January 2016). This is now referenced as the 2015/16 academic year. If you review any of these releases, you may see both used interchangeably.
Note: This first release is not human readable and requires a key to decode. This release was also quite primitive, as it only recorded the number of ethnic minority pupils as a percentage of total enrolment. The guidance given to schools could have led to ethnic minority students not being recorded if they were below a certain threshold as the guidance does not state whether this applied to class size or total enrolment at school or year level. A preliminary reading would suggest that around ≈ 10% of pupils in 1996 came from an ethnic minority background, which would imply the remaining ≈ 90% were white or didn’t have an ethnicity stated.
Note: The 1997 release added several white options, including “White UK”, “White European” and “White Other”, though nearly 1,000 schools didn’t bother disaggregating the different white groups and only reported the combined white total. A preliminary reading of this release would suggest around ≈ 87% of enrolment was white, with around ≈ 2.5% of pupils being unclassified and the remaining ≈ 10.5% being from an ethnic minority background. It is likely a majority of the unclassified pupils were white, as later releases showed a higher total white percentage. You can also find a Schools in England 1997 release listed on The National Archives, though it’s not available online.
From 1998 onwards, human readable bulletins are available in PDF or Excel formats, and pupils where an ethnicity isn’t stated are disaggregated, rather than being counted with white pupils as non-ethnic minority pupils.
1998: Schools in England 1998, Table 49a for primary schools and Table 49b for secondary schools
1999: Schools in England 1999, Table 49a for primary schools and Table 49b for secondary schools
2000: Schools in England 2000, Table 49a for primary schools and Table 49b for secondary schools
2001: Schools in England 2001, Table 47a for primary schools and Table 47b for secondary schools
2002: Statistics of Education Schools in England 2002 Edition, Table 47a for primary schools and Table 47b for secondary schools
Note: In 2002, the Department for Education and Skills (DfES) began introducing new ethnicity codes to align with the 2001 census. In the PDF, the DfES notes that only 4% of schools opted to use the new ethnicity codes, so the results were produced using the old ethnicity codes that the overwhelming majority of schools continued to use for this year.
2003: Statistics of Education Schools in England 2003 Edition, Table 47a for primary schools and Table 47b for secondary schools
Note: The 2003 release was overhauled by DfES (now Department for Education) and fully incorporated the new ethnicity codes to better align with the ethnicity categories in the 2001 census. It added many more ethnic categories, including “White British” and several mixed categories. For the 2003 release, use the corrections PDF or the Excel document, as the main PDF contains incorrect totals for ethnicity groups. The figures in the Excel document are rounded to the nearest 10. Figures in the corrections PDF are unrounded. I have used the Excel document figures for simplicity.
The following ethnicity categories have been used in England from 2003 onwards:
• White - White British
• White - Irish
• White - Traveller of Irish heritage
• White - Gypsy/Roma
• White - Any other White background
• Mixed - White and Black Caribbean
• Mixed - White and Black African
• Mixed - White and Asian
• Mixed - Any other Mixed background
• Asian - Indian
• Asian - Pakistani
• Asian - Bangladeshi
• Asian - Any other Asian background
• Black - Black Caribbean
• Black - Black African
• Black - Any other Black background
• Asian - Chinese
• Any other ethnic group
This is why 2003 was chosen as the starting point for the charts used in the Pimlico Journal article.
2004: Statistics of Education Schools in England 2004 Edition, Table 47a for primary schools and Table 47b for secondary schools
2005: Schools and Pupils in England: January 2005 (Final), Table 5 for both primary and secondary schools in the PDF. Table 32 for primary schools and Table 33 for secondary schools in the Excel document
2006: Schools and Pupils in England: January 2006 (Final), Table 5 for both primary and secondary schools in the PDF. Table 32 for primary schools and Table 33 for secondary schools in the Excel document
2007: DCSF: Schools and Pupils in England: January 2007 (Final), Table 5 for both primary and secondary schools in the PDF. Table 32 for primary schools and Table 33 for secondary schools in the Excel document
2008: DCSF: Special Educational Needs in England: January 2008, Table 8a for primary schools and Table 8b for secondary schools
Note: I don’t know why they didn’t publish a final version of the January 2008 data with the usual naming scheme, however if you read the PDF, it notes this release updates the provisional figures from the DCSF: Pupil Characteristics and Class Sizes in Maintained Schools in England: January 2008 (Provisional); the changes between both releases are minor and would not impact the overall percentages.
2009: DCSF: Schools, Pupils and Their Characteristics: January 2009, Table 4 in the Excel document for both primary and secondary schools
Note: While the 2009 release is labelled as provisional, the Excel documents are based on final data. This can also be cross-referenced by checking the DCSF: Special Educational Needs in England: January 2009 release.
Data from January 2010 onwards is much easier to access and less fragmented across different releases and with different naming schemes. The data is hosted on the official UK Government website and is maintained by the Department for Education (DfE).
While you can find 2010 (and newer) releases on The National Archives website, there is no point in using them, as this data is still maintained and accessible on the official UK Government website.
2010: Schools, pupils and their characteristics: January 2010, National tables: SFR09/2010, Table 4
2011: Schools, pupils and their characteristics: January 2011, Main national tables: SFR12/2011, Table 4
2012: Schools, pupils and their characteristics: January 2012, National tables: SFR10/2012, Table 4a
2013: Schools, pupils and their characteristics: January 2013, National tables: SFR21/2013, Table 4a
2014: Schools, pupils and their characteristics: January 2014, National tables: SFR15/2014, Table 4a
2015: Schools, pupils and their characteristics: January 2015, National tables: SFR16/2015, Table 4a
January 2016 – January 2026, or if using the new naming scheme, the 2015/16 – 2025/26 academic year
From the 2015/16 academic year onwards, the DfE changed how the data is released. While you can find the Schools, pupils and their characteristics: January 2016 release on the website (including the 2017, 2018 and 2019 releases as well), it’s much simpler to download the ZIP file from the latest Schools, pupils and their characteristics release, currently 2025/26, extract the ZIP file and in the ‘data’ folder, open spc_pupils_ethnicity_and_language.
You can sort at the national level, disaggregate state-funded primary and secondary schools and view the exact number and percentage of pupils from the 2015/16 to 2025/26 academic year.
Note: From January 2018 onwards, ethnicity was collected for children below compulsory school age. Prior to January 2018, it was only collected for compulsory school age children. This change did not significantly alter the percentages for any ethnic group, though (expectedly) it did increase total numbers in each ethnic group and total pupils listed.
In the example below, I have taken the CSV file, sorted the period to the 2015/16 academic year, set the geographic level to national and sorted to only show state-funded primary schools. You can do the same for state-funded secondary schools or show the total.
There is some disparity between the figures, the Schools, pupils and their characteristics: January 2016 release shows a total of 3,655,225 pupils in state-funded primary schools, of which 2,483,503 were White British. The CSV file, once sorted, shows a total of 3,656,083 pupils in state-funded primary schools, a difference of 858, and shows a total of 2,483,503 White British pupils, a difference of zero. As the CSV file is supported and still updated, capturing any late registrations or imputation errors, I am taking it as the authoritative source.
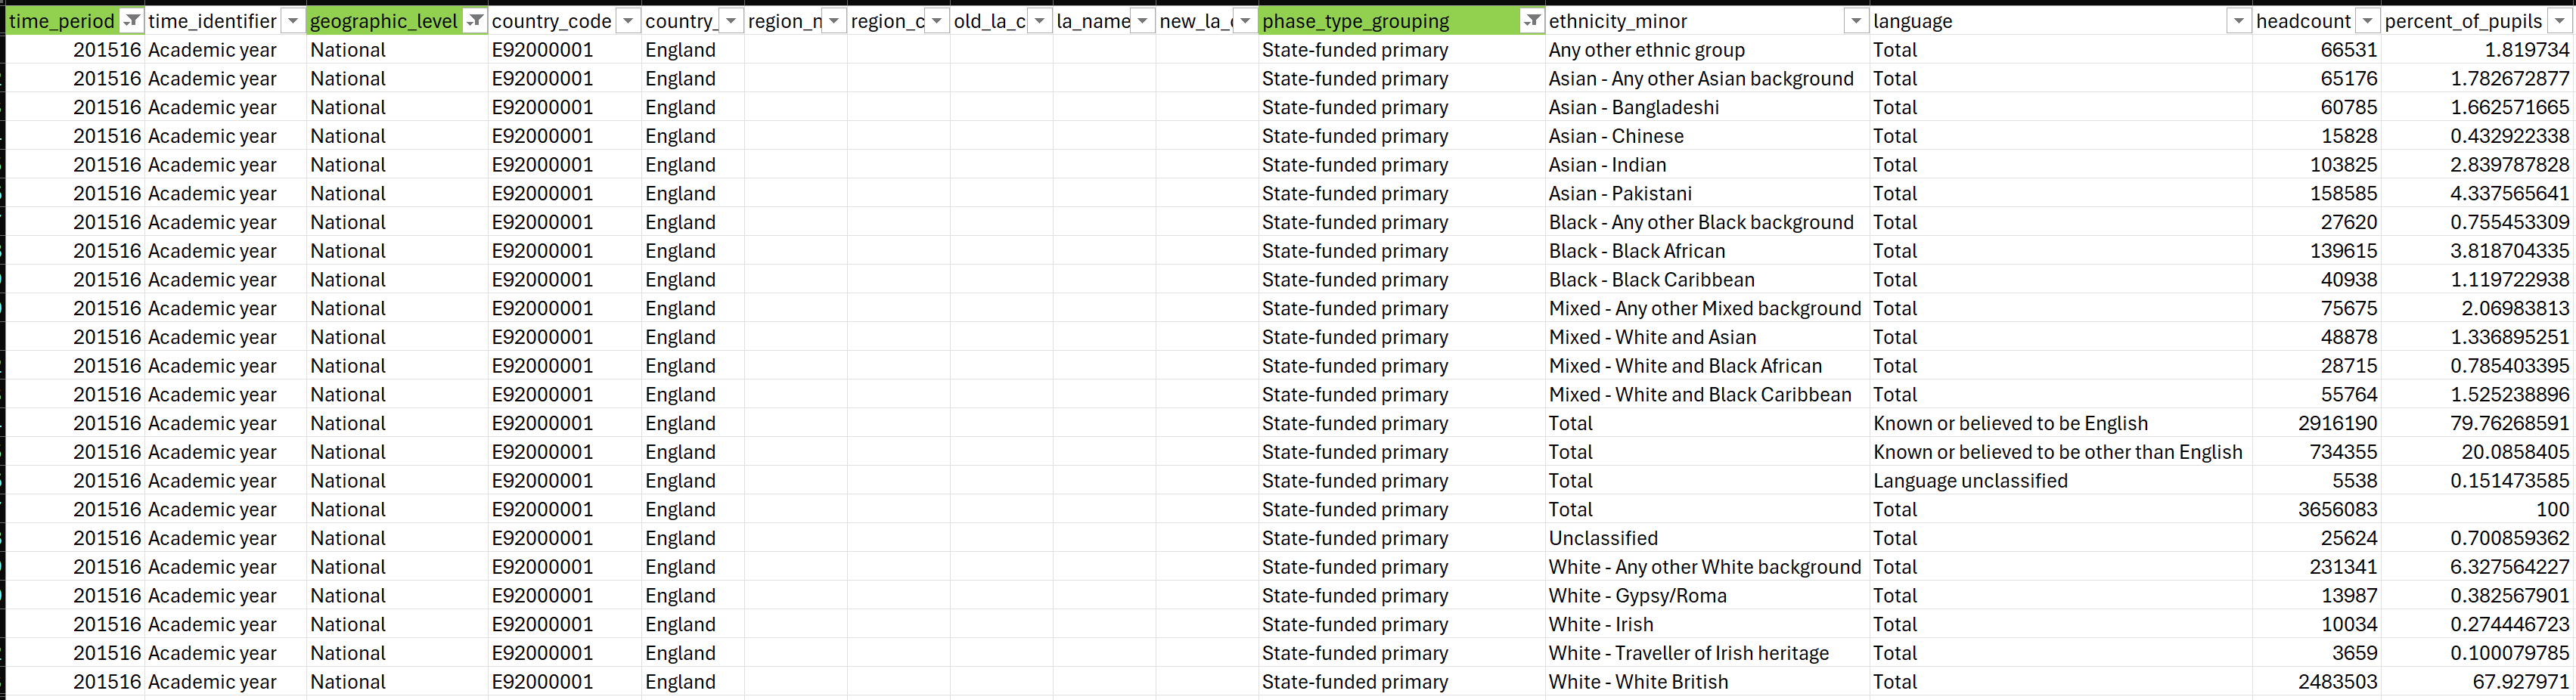
You can then copy across the figures for all ethnic groups and build a document that covers 1998 to 2026 and work out the percentages for all ethnic groups, across all years, in both state-funded primary and secondary schools.
Ethnic minority is defined as all ethnicities excluding ‘White British’ and excluding pupils who don’t have an ethnicity stated. This aligns with how the DfE produce these statistics and the accompanying summaries on what percentage of school enrolment are ethnic minority pupils.
Schools in Wales
Pupils aged 5 or over by ethnic background, 2004 to 2025. This ad-hoc release was produced by the Welsh Government schools’ statistical team.
Table1 covers all years from 2004 to 2025, including numbers and percentages for all ethnic groups, across all years.
The following ethnicity categories have been used from 2004 onwards:
• White British
• Traveller
• Gypsy/Roma
• Any other White background
• White and Black Caribbean
• White and Black African
• White and Asian
• Any other mixed background
• Indian
• Pakistani
• Bangladeshi
• Any other Asian background
• Black Caribbean
• Black African
• Any other Black background
• Chinese
• Any other ethnic group
The ethnicity categories used in Wales closely align with the ethnicity categories used in England.
Ethnic minority is defined as all ethnicities except ‘White British’ and excluding pupils who don’t have an ethnicity stated.
This aligns with how the Welsh Government produce these statistics and the accompanying summaries on what percentage of school enrolment are pupils from an ethnic minority background.
2026: Schools’ census results: January 2026, Table_13
Schools in Scotland
All releases below cover 2003 to 2025: Pupil census supplementary statistics
Pupil census 2007 supplementary statistics, Table 1.11 for 2007 and 1.12 for 2003, 2004, 2005 and 2006
Pupil census 2008 supplementary statistics, Table 1.10
Pupil census 2009 supplementary statistics, Table 1.10
Pupil census 2010 supplementary tables, Table 1.9
Pupil census 2011 supplementary tables, Table 1.10
Pupil census 2012 supplementary tables, Table 1.10
Pupil census 2013 supplementary tables, Table 1.10
Pupil census 2014 supplementary tables, Table 1.10
Pupil census 2015 supplementary tables, Table 1.10
Pupil census 2016 supplementary tables, Table 1.10
Pupil census 2017 supplementary tables, Table 1.10
Pupil census 2018 supplementary tables, Table 1.10
Pupil census 2019 supplementary tables, Table 1.10
Pupil census 2020 supplementary statistics, Table 1.10
Pupil census 2021 supplementary statistics, Table 1.10
Pupil census 2022 supplementary statistics, Table 1.10
Pupil census 2023 supplementary statistics, Table 1.10
Pupil census supplementary statistics 2024, Table 1.10
Pupil census supplementary statistics 2025, Table 1.10
The following ethnicity classifications were used from 2003 to 2010:
• White - UK
• White - Other
• Mixed
• Asian - Indian
• Asian - Pakistani
• Asian - Bangladeshi
• Asian - Chinese
• Asian - Other
• Black - Caribbean
• Black - African
• Black - Other
• Occupational Traveller
• Gypsy/Traveller
• Other Traveller
• Other
• Not known/Not disclosed
The following ethnicity classifications were used from 2011 to 2019:
• White - Scottish
• White - Other
• White - Gypsy/Traveller
• White - Polish
• White - Irish
• Mixed
• Asian - Indian
• Asian - Pakistani
• Asian - Bangladeshi
• Asian - Chinese
• Asian - Other
• Caribbean/Black
• African
• Arab
• Other
• Not known/not disclosed
The following ethnicity classifications have been used from 2020 onwards:
• White - Scottish
• White - Other British
• White - Irish
• White - Polish
• White - Gypsy/Traveller
• White - Other
• Mixed
• Asian - Indian
• Asian - Pakistani
• Asian - Bangladeshi
• Asian - Chinese
• Asian - Other
• Caribbean/Black - Scottish/British
• Caribbean/Black - Other
• African - Scottish/British
• African - Other
• Arab
• Other
• Not known
• Not disclosed
From 2003 to 2010, ethnic minority is defined as all ethnicities, except ‘White – UK’ and excluding pupils whose ethnicity was not known or not disclosed.
From 2011 to 2019, ethnic minority is defined as all ethnicities, except ‘White – Scottish’ and excluding pupils whose ethnicity was not known or not disclosed.
From 2020 onwards, ethnic minority is defined as all ethnicities, except ‘White – Scottish’ and ‘White – Other British’ and excluding pupils whose ethnicity was not known or not disclosed.
Schools in Northern Ireland
From 2005/06 to 2014/15, ethnicity data was included in both Table 6a and 6b. Table 6a covered nursery schools, nursery classes, reception and other pre-school centres. Table 6b covered nursery schools, nursery classes, reception, primary schools, secondary schools, grammar schools and special schools.
Table 6b is used for 2005/06 to 2014/15. For all following years, Table 6a is used.
Note: There was industrial action for the 2023/24 academic year, and no ethnicity data was recorded. This year has been left blank.
Enrolments at schools and in funded pre-school education in Northern Ireland 2005/06, Table 6b
Enrolments at schools and in funded pre-school education in Northern Ireland 2006/07, Table 6b
Enrolments at schools and in funded pre-school education in Northern Ireland 2007/08, Table 6b
Enrolments at schools and in funded pre-school education in Northern Ireland 2008/09, Table 6b
Enrolments at schools and in funded pre-school education in Northern Ireland 2009/10, Table 6b
Enrolments at schools and in funded pre-school education in Northern Ireland 2010/11, Table 6b
Enrolments at schools and in funded pre-school education in Northern Ireland 2011/12, Table 6b
Enrolments at schools and in funded pre-school education in Northern Ireland 2012/13, Table 6b
Enrolments at schools and in funded pre-school education in Northern Ireland 2013/14, Table 6b
Enrolments at schools and in funded pre-school education in Northern Ireland 2014/15, Table 6b
Enrolments at schools and in funded pre-school education in Northern Ireland 2015/16, Table 6a
Enrolments at schools and in funded pre-school education in Northern Ireland 2016/17, Table 6a
Enrolments at schools and in funded pre-school education in Northern Ireland 2017/18, Table 6a
Enrolments at schools and in funded pre-school education in Northern Ireland 2018/19, Table 6a
Enrolments at schools and in funded pre-school education in Northern Ireland 2019/20, Table 6a
Enrolments at school and in funded pre-school education in Northern Ireland 2020/21, Table 6a
Enrolments at school and in funded pre-school education in Northern Ireland 2021/22, Table 6a
Enrolments at school and in funded pre-school education in Northern Ireland 2022/23, Table 6a
Enrolments at school and in funded pre-school education in Northern Ireland 2023/24, N/A due to industrial action, no ethnicity figures recorded
Enrolments at school and in funded pre-school education in Northern Ireland 2024/25, Table 6a
Enrolments at school and in funded pre-school education in Northern Ireland 2025/26, Table 6a
The mainline Northern Ireland school enrolment statistics do not include the number of pupils who don’t have an ethnicity stated. An ad-hoc request was obtained from the Statistical Analysis Team at the Department of Education covering 2010/11 to 2025/26, with more detailed ethnic breakdowns and the number of pupils without a stated ethnicity. The number of unclassified pupils is remarkably low in Northern Ireland, consistently below 1,000 a year and sometimes as few as 7, so would not impact headline figures.
If you wish to acquire this ad-hoc release, you can email statistics@education-ni.gov.uk and request the document titled “Compulsory school age pupils in NI schools by ethnic background”. I have also included a screenshot of the table below.
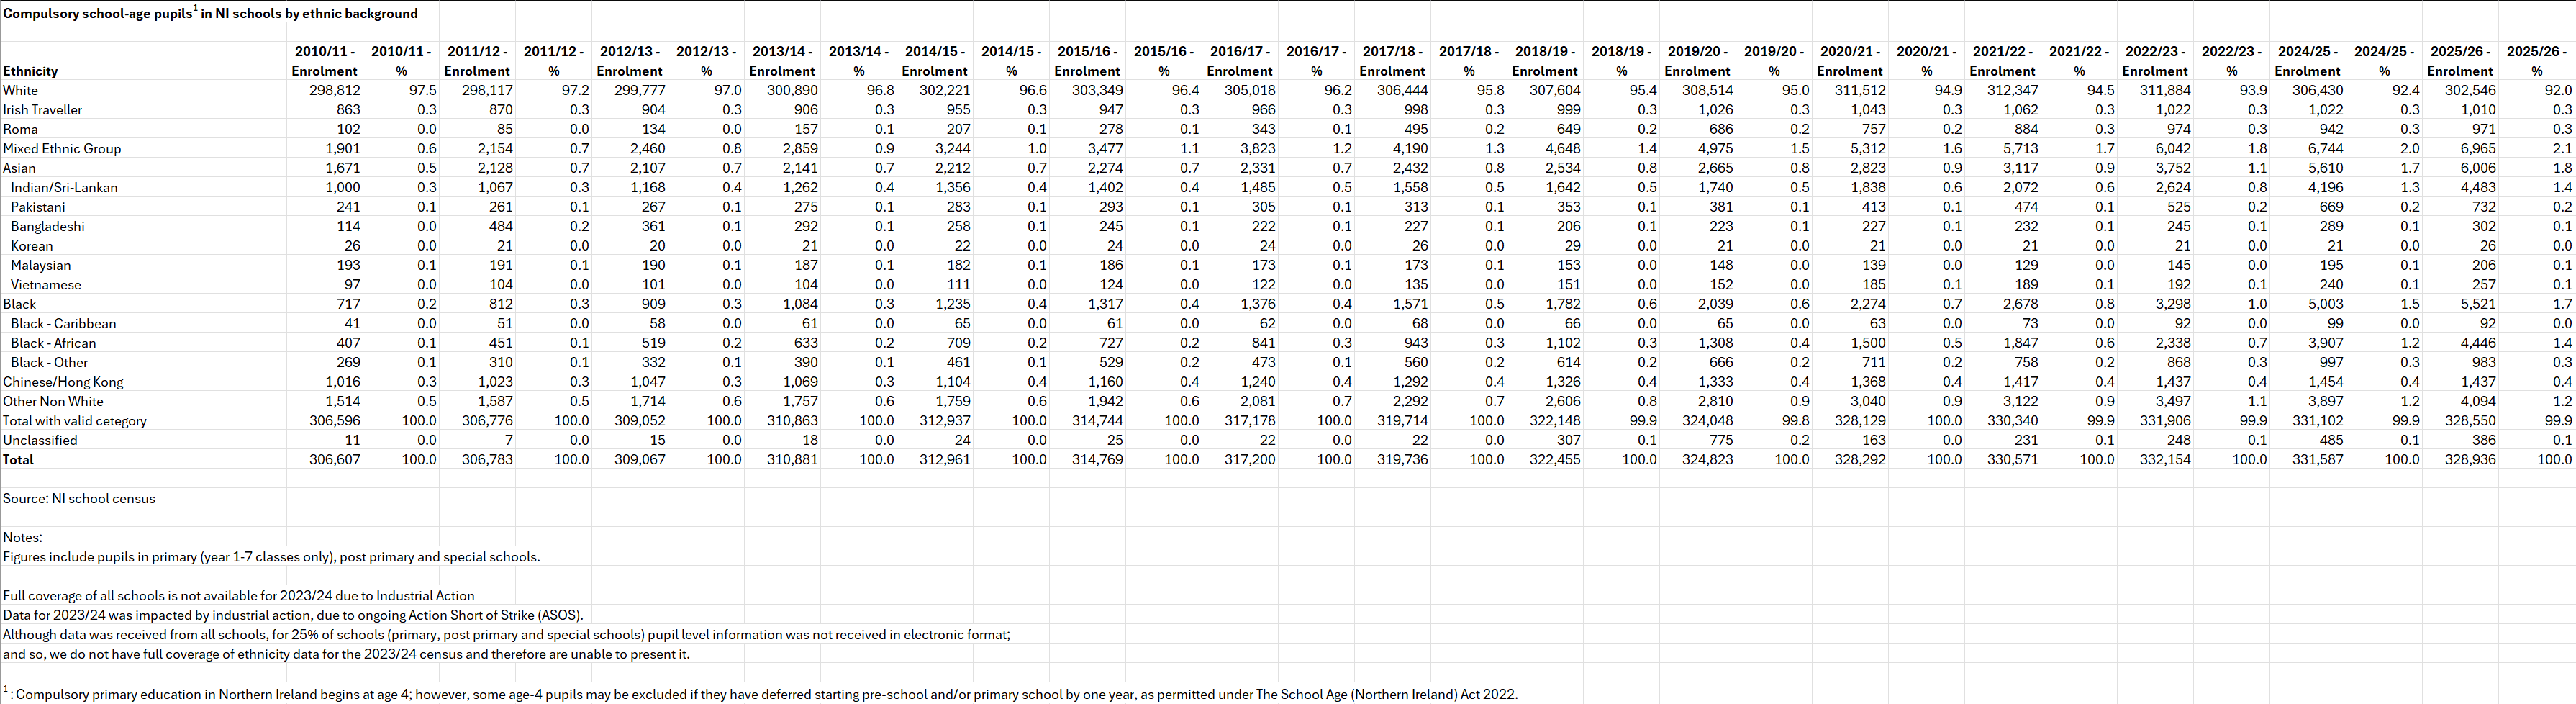
For Northern Ireland, two charts have been created, one showing the ethnicity of pupils from 2005/06 to 2025/26 and a second using the ad-hoc release covering 2010/11 to 2025/26, which includes pupils without a stated ethnicity and breaks down ethnicity into more granular categories.
In the mainline releases, the following ethnicity classifications have been used:
• White (excluding Irish Traveller)
• Chinese
• Irish Traveller
• Indian/Sri-Lankan
• Pakistani
• Black
• Other ethnic group
• Mixed ethnic group
In the ad-hoc commissioned table, the following ethnicity classifications are used:
• White
• Irish Traveller
• Roma
• Mixed Ethnic Group
• Indian/Sri-Lankan
• Pakistani
• Bangladeshi
• Korean
• Malaysian
• Vietnamese
• Black - Caribbean
• Black - African
• Black - Other
• Chinese/Hong Kong
• Other Non White
• Unclassified
In the mainline release, ethnic minority is defined as all pupils other than ‘White (excluding Irish Traveller)’.
In the ad-hoc release, ethnic minority is defined as all pupils other than ‘White (excluding Irish Traveller)’ and excluding pupils whose ethnicity isn’t stated.
The difference between the two charts is marginal. For the Pimlico Journal article, only the 2006 to 2026 chart was used.
Independent (private) schools
The Independent Schools Council (ISC) publishes a yearly census, and some participating independent schools provide ethnicity information. According to the ISC, they cover 85% of pupils in the UK who are educated in independent schools, so this is the most accurate method available.
ISC Annual Census 2009, Fig 4a
ISC Annual Census 2010, Fig 6
ISC Annual Census 2011, Fig 6
ISC Annual Census 2012, Fig 6
ISC Annual Census 2013, Fig 17
ISC Annual Census 2014, Fig 15
Note: From 2009 to 2014, the ISC census excluded boarding schools for ethnicity figures. For all census releases from 2015 and onwards, boarding schools are included if the boarding school reported ethnicity information. This did not significantly alter the percentage of pupils who were White British or from an ethnic minority background, nor did it impact overall trends.
ISC annual Census 2015, Fig 21
ISC annual Census 2016, Fig 16
ISC annual Census 2017, Fig 16
ISC annual Census 2018, Fig 16
ISC annual Census 2019, Fig 16
ISC annual Census 2020, Fig 15
ISC annual Census 2021, Fig 15
ISC annual Census 2022, Fig 15
ISC annual Census 2023, Fig 16
ISC annual Census 2024, Fig 16
ISC annual Census 2025, Fig 18
ISC annual Census 2026, Table 3.4